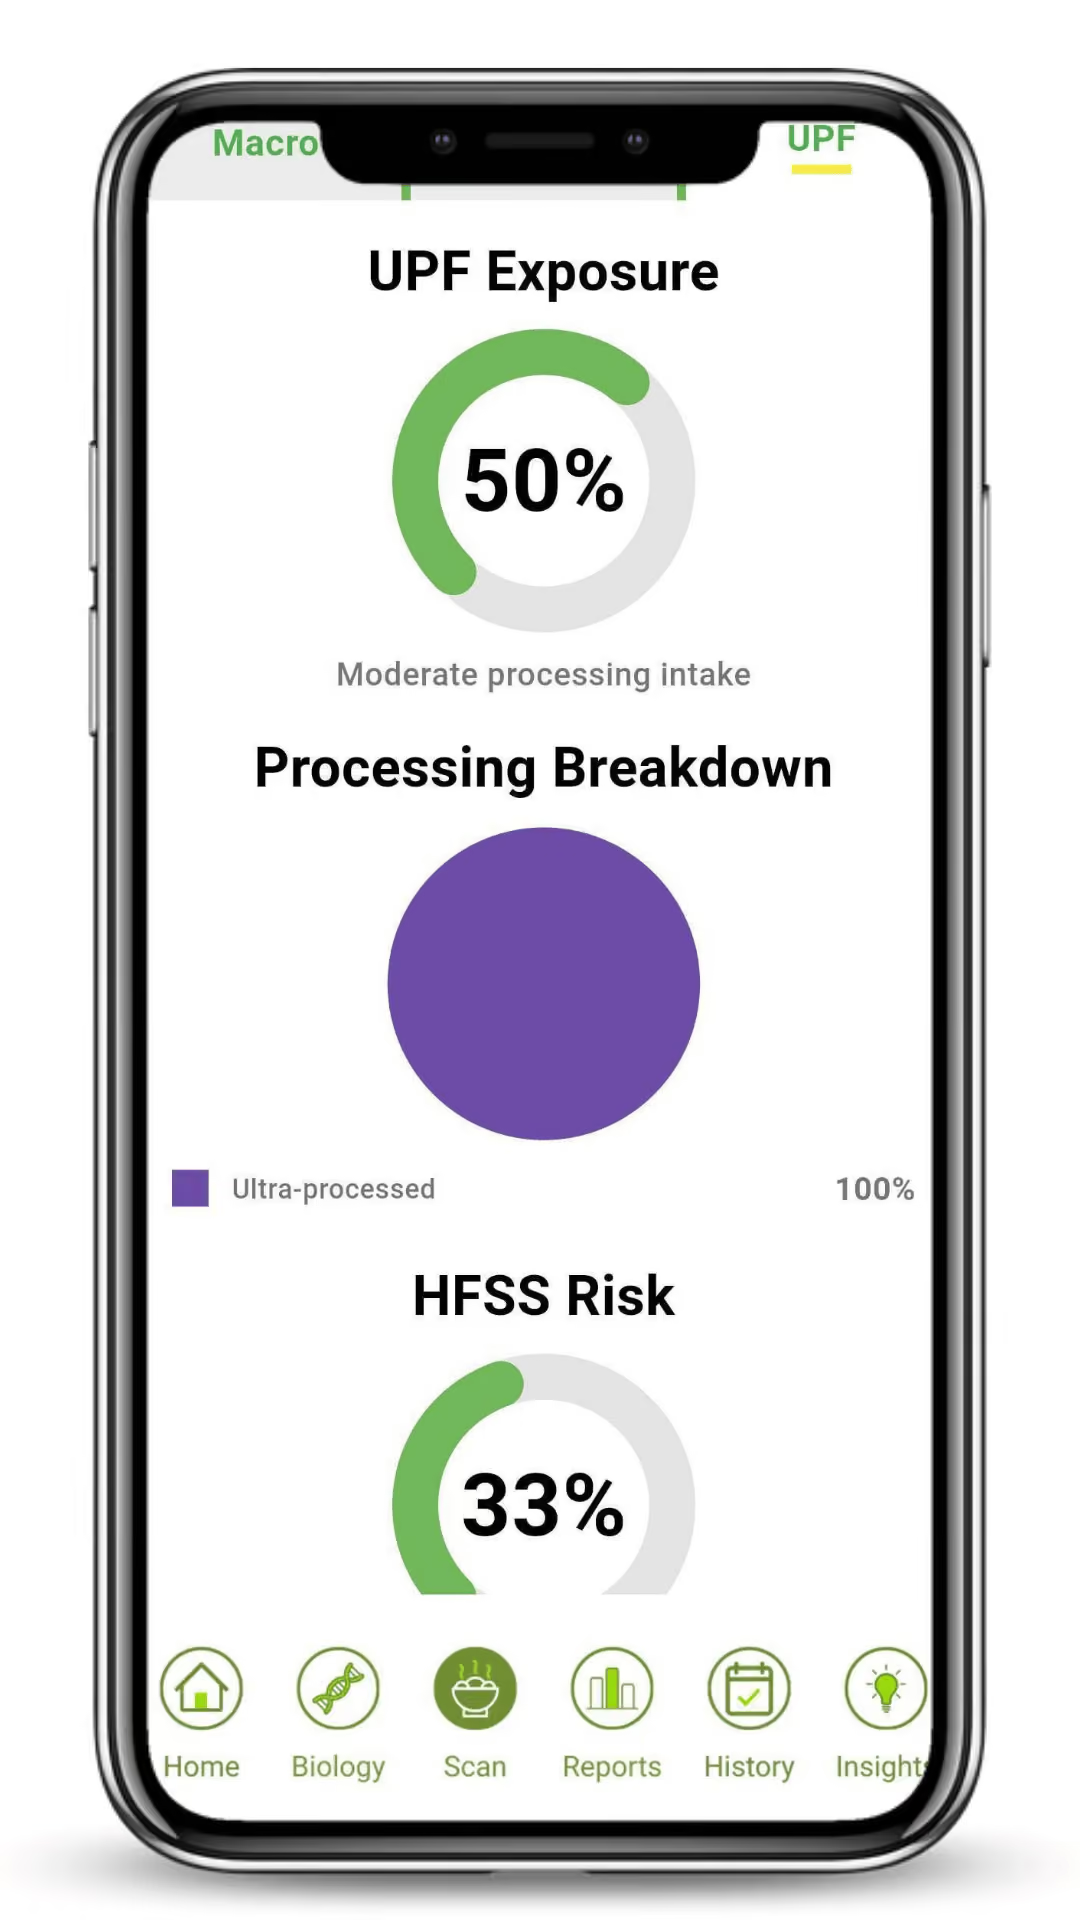
See how processed your meals, your shopping and your week really are. Scan a product in the aisle, log a meal at home, and watch the trend over time.


Free to start. No DNA test needed. Your data is never sold.
of calories
National diet survey data shows ultra-processed food makes up around 57% of the calories in the average UK diet, and that share barely moved between 2008 and 2019. It isn't about willpower. It's what fills the shelves, and most of it is hard to spot from the front of the pack.
Sources: Rauber et al. (2018), Nutrients, UK National Diet and Nutrition Survey 2008 to 2014. Madruga et al. (2023), British Journal of Nutrition, 2008 to 2019 trend.
Boone uses NOVA, the most widely used system for classifying food by how much it has been processed. Every food falls into one of four groups.
Food as it comes, or changed only by washing, freezing, drying or similar.
Fruit, vegetables, eggs, plain milk, oats, fresh meat and fish
Ingredients taken from foods and used in cooking.
Oils, butter, sugar, salt, flour
Group 1 foods with a few group 2 ingredients added, usually to preserve them.
Tinned vegetables, cheese, simple fresh bread
Industrial products made mostly from extracted or modified ingredients, often with additives you wouldn't use at home.
Fizzy drinks, packaged snacks, most ready meals, mass-produced sliced bread
Scan a barcode before it goes in the basket and see its processing rating alongside macros and micronutrients.
Food barcode scannerScan your receipt and see how processed your whole shop was, item by item.
Receipt scannerEvery meal you log by photo or text gets a rating too, so home cooking and eating out count as well.
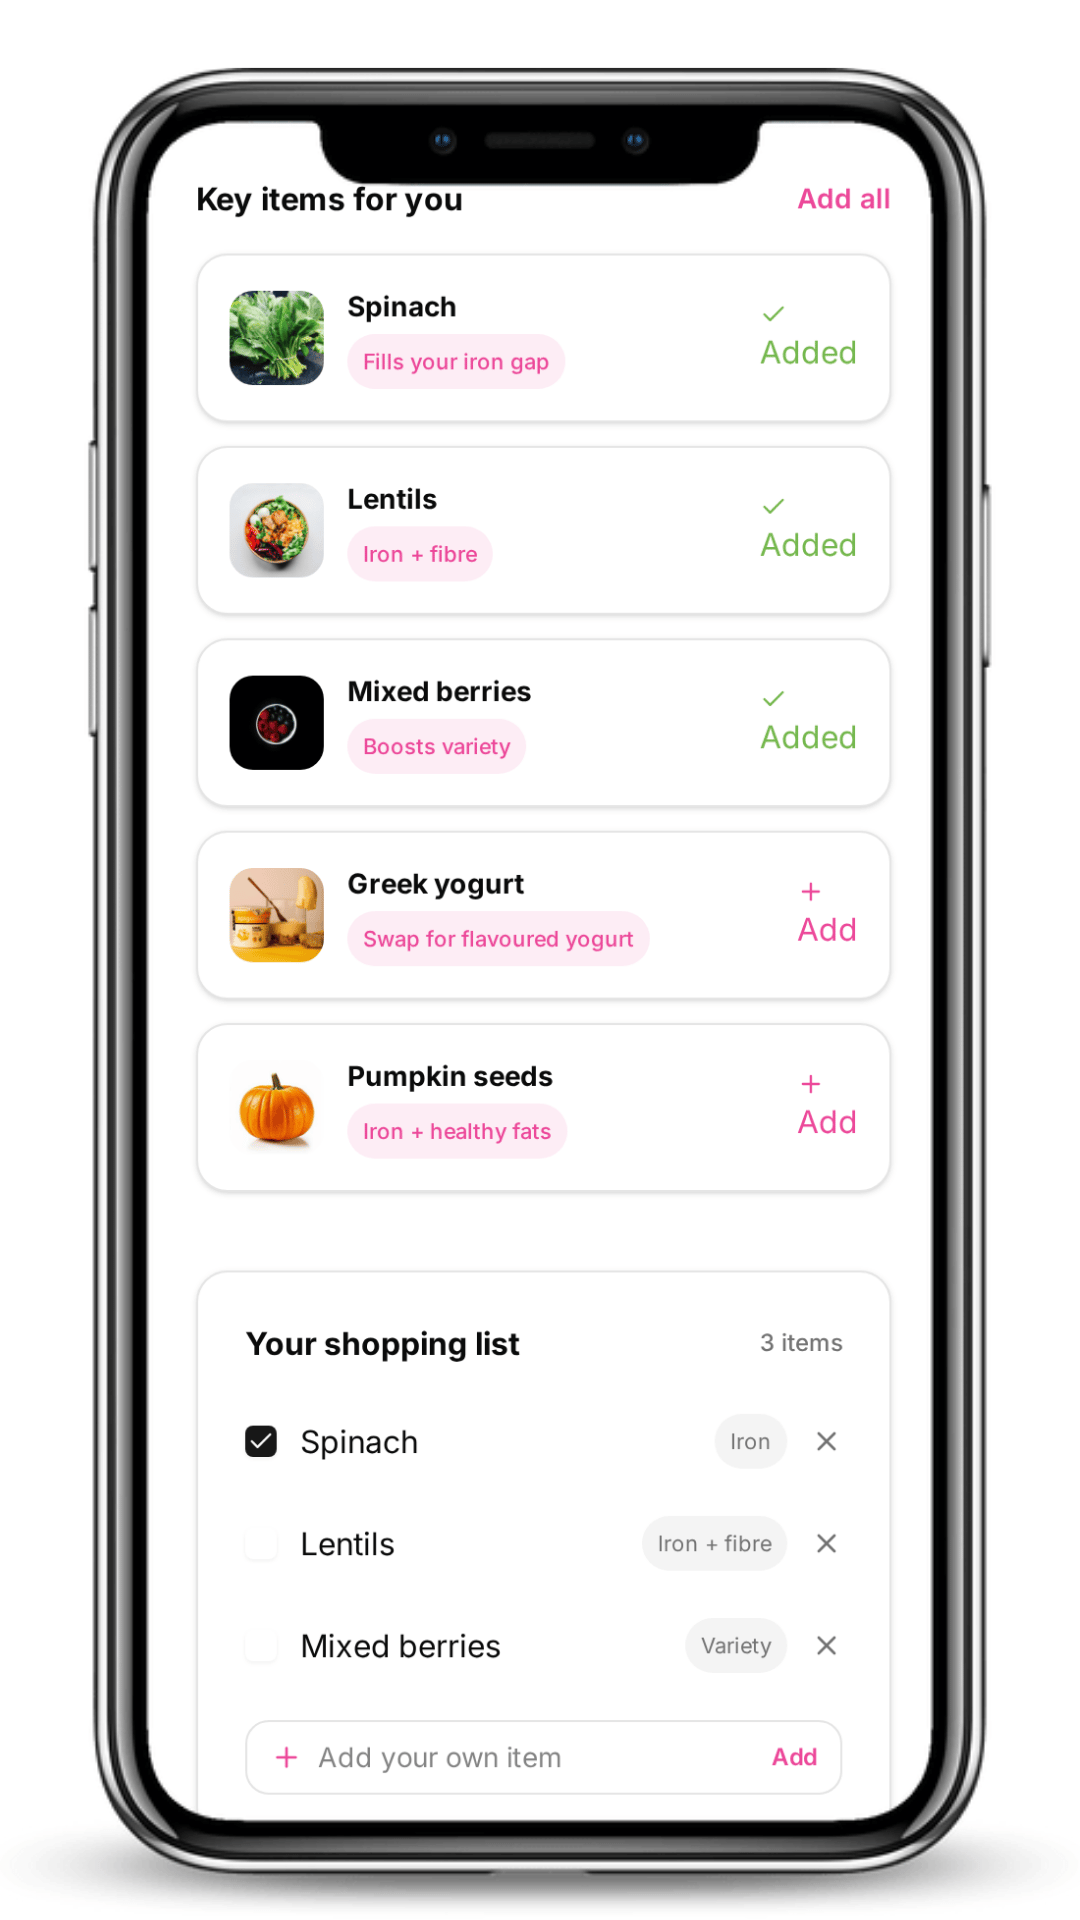
All the ways to logBoone suggests individual ingredients that fill your gaps, chosen to be close to what you already eat. Add them to your shopping list in a tap.