

Figures from Subway UK and Ireland nutrition guide, September 2026 , collected by Boone
Mini Cookies and Caramel Dip, as published. Calorie split calculated by Boone. How
The Mini Cookies and Caramel Dip as published, seen four ways.
2 of 3 limits are over 30% in one serving, the UK front-of-pack mark for high.
Free sugar is the biggest issue: 48g is 160% of an adult’s daily 30g in one serving.
 Lower free sugarOat and Raisin Cookie →14g free sugar (47%), 140 kcal
NHS limits by age: salt goes from 17% for an adult to 33% at age 4 to 6.
For age 4 to 6, free sugar is the bigger share: 48g is 253% of the day’s 19g limit.
 Lower-salt swapRainbow Cookie →0.1g salt, 3% of the 3g limit
For age 7 to 10, free sugar is the bigger share: 48g is 200% of the day’s 24g limit.
Lower-salt swapRainbow Cookie →0.1g salt, 2% of the 5g limitFor age 11 to 17, free sugar is the bigger share: 48g is 160% of the day’s 30g limit.
Lower-salt swapRainbow Cookie →0.1g salt, 2% of the 6g limitProtein counts in your favour here, but the saturated fat is still 55% of the adult limit.
5g of protein, #131 on the menu. Per calorie the Chicken Tikka Protein Pot gives more: 20.2g per 100 kcal against 0.9g.
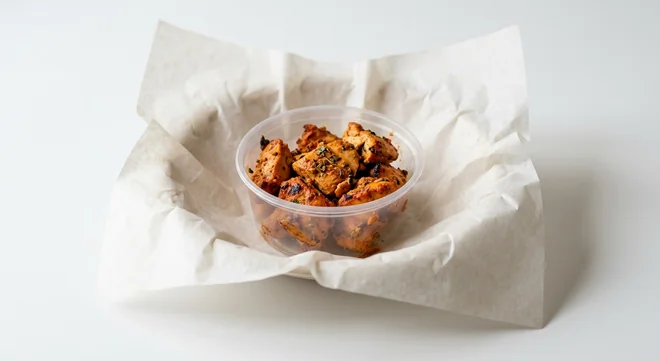 Most protein per calorieChicken Tikka Protein Pot →18g protein in 89 kcal
Here the 400mg of sodium counts as useful after sweaty exercise.
79g of carbohydrate, with 36% of the energy from fat.
Natural sugars in milk, fruit and veg don’t count. NHS →
For smaller portions: the most nutrition per calorie, against all 152 Subway items.
More protein per calorie than 7% of the 152 items on the menu.
More fibre per calorie than 12% of the 152 items on the menu.
Subway does not publish vitamins or minerals for this item, so Boone does not estimate them.
The 2018 model indicates this serving is less healthy: it scores 24, above the line of 4.
Higher is less healthy; 4 or more would be classed as less healthy under this model. How the score works →
Joint #117 of 119 on the menu for this score (lower is better).
UK Nutrient Profiling Model 2018 →UK law does not require one for food made to order or sold loose, so Boone cannot count the ingredients or list the additives. Allergens are listed above, as published by Subway. Recipes change, so check in the restaurant if you have an allergy.
 Matcha and White Chip Cookie 2.4g protein, 0.3g salt193
 Pumpkin Spiced Cookie 2.3g protein, 0.2g salt194Rainbow Cookie 2g protein, 0.1g salt214
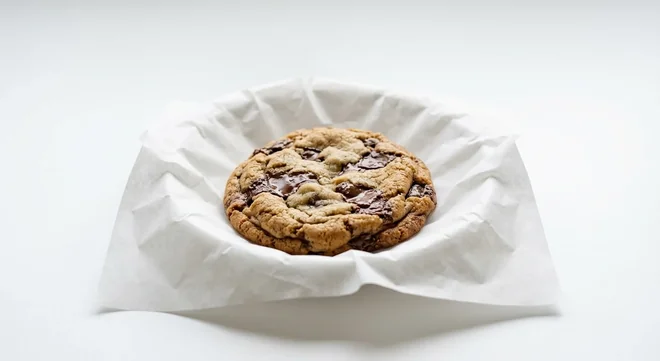 Chocolate Chunk Cookie 2.3g protein, 0.3g salt214
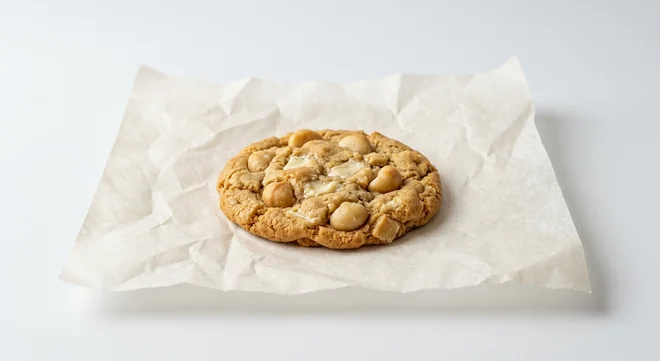 White Macadamia Nut Cookie 2.3g protein, 0.4g salt215
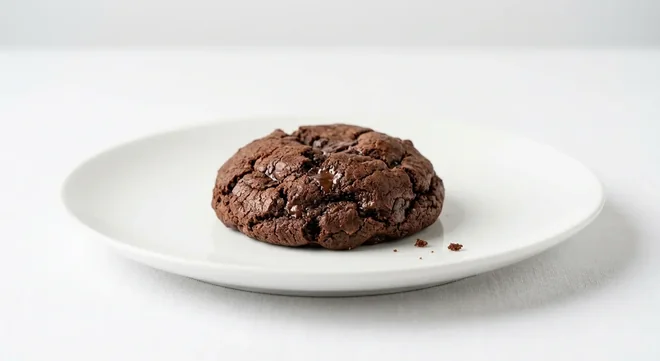 Vegan Double Chocolate Cookie 2g protein, 0.3g salt220
 Brownie Cookie Cup 2.7g protein, 0.4g salt266
 Mini Cookies and Caramel Dip 5g protein, 1g salt532
532 kcal as published. 532 kcal is 27% of a 2,000 kcal adult reference intake.
For a child aged 4 to 6 it is 33% of the day’s 3g salt limit and 253% of the 19g free sugar limit in one item. A Rainbow Cookie has 0.1g of salt, 3% of that salt limit.
48g of total sugar as published. Boone estimates 48g of it is free sugar: 12.0 teaspoons and 160% of an adult’s 30g daily maximum.
5g, 0.9g per 100 kcal. It ranks #131 of 153 items on the menu for protein. The Chicken Tikka Protein Pot gives the most protein for the calories, 20.2g per 100 kcal.
24 on the UK Nutrient Profiling Model 2018, calculated by Boone per 100g. Scores run from -20 to 40, and the higher the score, the less healthy the model rates the food. Foods scoring 4 or more would be classed as less healthy under this model.
As published, wheat, soya, milk and eggs. Tree nuts may be present.
Source. Subway UK and Ireland nutrition guide, September 2026 , per item as sold.
Collected. Copied by Boone from Subway’s published figures. Data checks are led by Murray Dare.
Calculated by Boone. Labelled where it appears.
Limits. NHS free sugar and salt limits by age; UK reference intakes for adults.
Cookies on Boone
We use analytics cookies to see how people use the site so we can improve it. They are only set if you accept. Cookie policy
