
Burger King, the least healthy first
57 Burger King UK items, scored with the UK Nutrient Profiling Model 2018. Lower is healthier. Food scoring 4 or more, and drinks scoring 1 or more, count as less healthy.
NPM 2018 score
57 items, least healthy first. Bacon Caesar AngusBurgers and chickenLess healthyBad points 25, good points 0. 869 kcal in a 254g portion252
 Mango and Passionfruit Cheesecake BarDessertsLess healthyJointBad points 23, good points 0. 264 kcal in a 80g portion233Mango and Passionfruit Cheesecake BarGroup 6Less healthyJointBad points 23, good points 0. 264 kcal in a 80g portion234
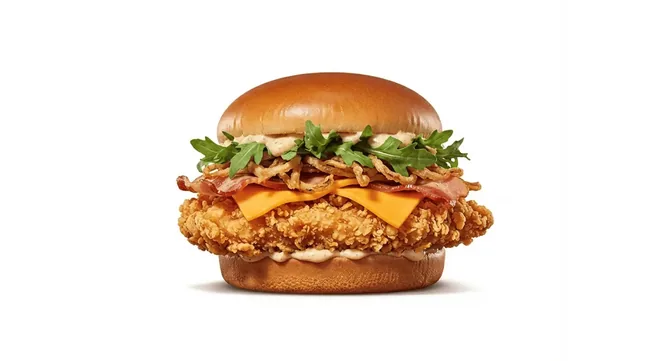 Bacon Caesar Crispy ChickenBurgers and chickenLess healthyBad points 22, good points 0. 762 kcal in a 246g portion225
 BBQ Steakhouse Crispy ChickenBurgers and chickenLess healthyBad points 19, good points 0. 637 kcal in a 240g portion19
 Bacon Double Cheese XLBurgers and chickenLess healthyJointBad points 18, good points 0. 910 kcal in a 310g portion187
 BBQ Steakhouse AngusBurgers and chickenLess healthyJointBad points 18, good points 0. 792 kcal in a 280g portion188
 Bacon Double CheeseburgerBurgers and chickenLess healthyJointBad points 18, good points 0. 440 kcal in a 155g portion189
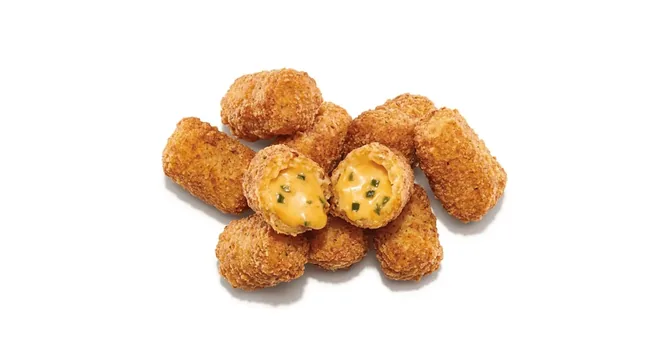 6 Chilli Cheese BitesFries and sidesLess healthyJointBad points 18, good points 0. 318 kcal in a 111g portion1810
 CheeseburgerBurgers and chickenLess healthyJointBad points 18, good points 0. 285 kcal in a 115g portion18
Item images are illustrations created by Boone, not photographs.
Healthier per 100g is not the same as lighter
The model judges what the food is made of, 100g at a time. It does not count how much is on the plate. For calories by portion, use the lowest calorie ranking.

- Score per 100g
- 3
- Per portion
- 506 kcal
A 180g portion. Scored per 100g, it comes out healthier.

- Score per 100g
- 15
- Per portion
- 152 kcal
A 98g portion. It scores as less healthy, at 30% of the calories.
Burger King score against portion size
Left of the line is healthier by the model, higher up is a bigger portion. Items under the line come from Fries and sides.
Healthiest in each Burger King menu section
The best score in each part of the menu.


Quick answers
What is the healthiest item at Burger King UK?+
The Small Fries, with a score of 3 on the UK Nutrient Profiling Model 2018. It has 225 kcal per portion.
What is the least healthy item at Burger King UK?+
The Bacon Caesar Angus, with a score of 25. Scores this high come from saturated fat, sugar, salt and energy per 100g.
How many Burger King items count as healthier?+
3 of the 57 items scored here are under the less healthy line: below 4 for food, below 1 for drinks.
What does the score mean?+
It is the UK Nutrient Profiling Model 2018, which scores food and drink per 100g from −15 to 40. Lower is healthier. It judges what the food is made of, not the portion size.
Each item is scored with the UK Nutrient Profiling Model 2018 (DHSC technical guidance), using Burger King’s published figures and portion weights. Where Burger King does not publish a portion weight, Boone estimates it from the median energy per gram of similar items and labels it as estimated.
Burger King does not publish fruit, vegetable or nut content, so those points count as 0, which can understate items with salad. 3 items, such as meals, sharers and dips, are not scored because the model scores single products. Ties are shown as joint and listed by calories.
How the NPM score works →